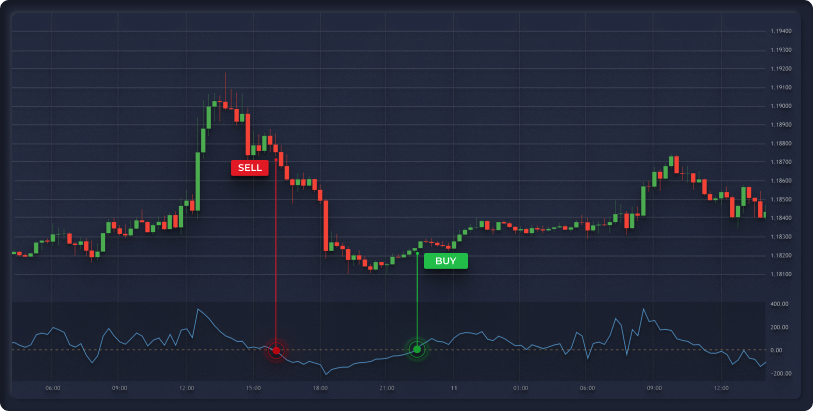
Signals are generated when level 50 is crossed. When crossing from top to bottom, a SELL signal is generated. When crossing from bottom to top, a BUY signal is generated. It must be above or below the level of the previous 6 candles to prevent false positives.
Category - Trending.
In this case, the CCI indicator shows that the trend has already begun. If the market conditions are favorable, the trend will continue.
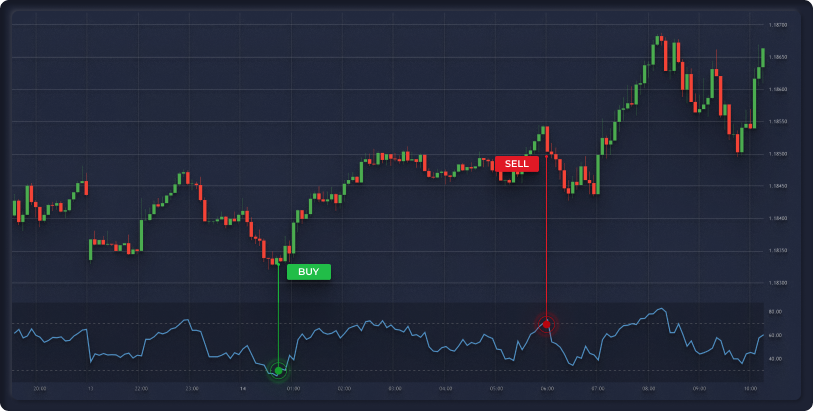
Signals to this algorithm are generated in the overbought and oversold zones. A BUY signal is generated when level 30 is crossed, and a SELL signal is generated when level 70 is crossed.
Category - Reversal.
Classical technical analysis tells us that if the price is in the overbought zone, a reversal will likely occur and the price will go down and vice versa.
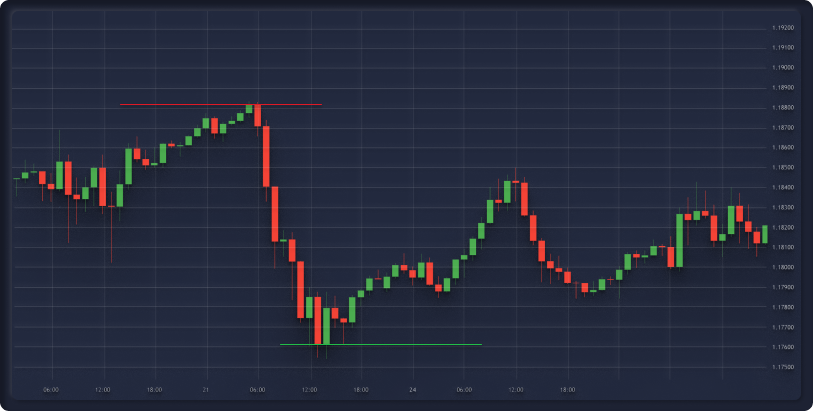
This algorithm uses local lows and highs to build support and resistance levels. The signal is generated when the price approaches any of the levels from any side at a distance of the middle candlestick equal to ATR (14).
A distinctive feature of this signal is that two BUY and SELL signals are formed at once - one signal for a rebound, the other signal for a breakdown. Using our statistical algorithms, we can calculate the most probable result given current market trends.
The category of signals depends on the trend indicator.
If the trend is up:
BUY Signal - Trending
SELL signal - Reversal
If the trend is down:
BUY Signal - Reversal
SELL signal - Trending


