Visit JT Lab

User menu

Sign up Login

How does it work?

signal

xSignals फॉरेक्स ब्रोकर और क्रिप्टोकरेन्सी एक्सचेंजों पर ट्रेडिंग के लिए विश्लेषणात्मक उपकरणों का एक पूरा सेट है

More than 10 tools for detailed market analysis are available in the xSignals app: forex and crypto signals, online charts, trend indicator, and popular technical indicators.

अपनी ट्रेडिंग रणनीति की पुष्टि करने के लिए सिगनल्स और अतिरिक्त संकेतकों का उपयोग करें।

signal
arrow_down

how to use?

सिग्नल संरचना

Study the structure of the signal and the meaning of each element of the signal in order to read the data for market analysis correctly. Signals are generated automatically based on technical analysis. The signal contains the supposed direction of the price and statistical data calculated on the history of signals and quotes history. In addition, statistical data showing the profitability of signals depending on various technical indicators are provided in the form of signal power and heatmaps.

सिगनल को ट्रेडर के लिए बाजार में हुई कुछ महत्वपूर्ण घटना की एक अधिसूचना के रूप में माना जाना चाहिए। उदाहरण के लिए, आरएसआई संकेतक एक सिगनल देता है कि कीमत ओवरबॉट है या ओवरसोल्ड है, हालांकि सिगनल में एक उलट दिशा भी है, लेकिन इसका मतलब यह नहीं है कि कीमत निश्चित रूप से उलट जाएगी। सिगनल पर पोजीशन खोलने के लिए ट्रेडर को बाजार के अपने अतिरिक्त ज्ञान का उपयोग करना चाहिए।

?

सिगनल पैनल

फास्ट बटन

ट्रेडिंग सिगनल पैनल

AUDUSD

SELL

0.71716

08:00

5 min

SRt

0.01

0.02

0.03

4/2

6/2

6/3

9/3

8/4

12/4

0.9

1.1

1.1

1.1

1.1

1.1

वित्तीय एसेट

पावर और हीटमैप्स

signal-power signal-power signal-power signal-power signal-power signal-power

iPP

0.5

iSummary

0.8

iWPR

1

iMomentum

1.2

iBulls

1.5

iBears

>2

सिगनल पावर की गणना कई एक समान पूर्ण सिगनल और रुझान मान के डेटा के आधार पर की जाती है। यह एक समय सीमा के लिए वर्तमान संकेतक मान का परिणाम दिखाता है।

हीटमैप्स वर्तमान सिगनल्स के आधार पर सिगनल्स की लाभप्रदता का एक ग्राफिकल प्रतिनिधित्व है। हीटमैप विभिन्न फ़िल्टरिंग संकेतकों का उपयोग करके सिगनल्स की लाभप्रदता (लाभ कारक) दिखाते हैं।


फ़िल्टरिंग संकेतक रुझान, पिवट पॉइंट, सारांश, विलियम्स प्रतिशत रेंज, मोमेंटम, बुल, बियर का उपयोग लाभ कारक गणना के लिए संकेतों के चयन के निर्माण के लिए किया जाता है।

Profit Factor

The profit factor is a performance indicator of a trading strategy, defined as the ratio of gross profit to gross losses. The sum of all profitable deals is divided by the sum of all losing deals. The trading system is profitable if the profit ratio is above 1.0.

Each signal algorithm is used as a trading strategy to calculate the profit factor. The trading strategy should contain:

  1. 1. Rules for opening positions at the moment of appearance of signals.
  2. 2. स्टॉप ऑर्डर देने के नियम: नुक्सान रोकें और लाभ लें।

पावर, हीटमैप, लाभ कारक के बारे में

सिगनल एल्गोरिदम

कमोडिटी चैनल इंडेक्स (सीसीआई)

सापेक्ष शक्ति इंडेक्स (आरएसआई)

समर्थन और प्रतिरोध

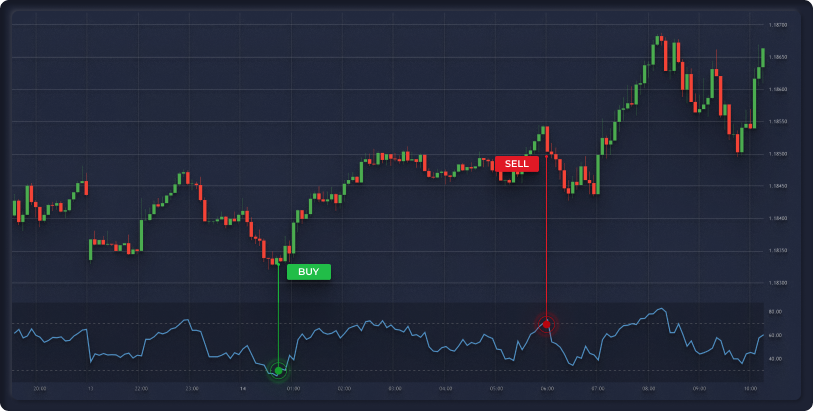
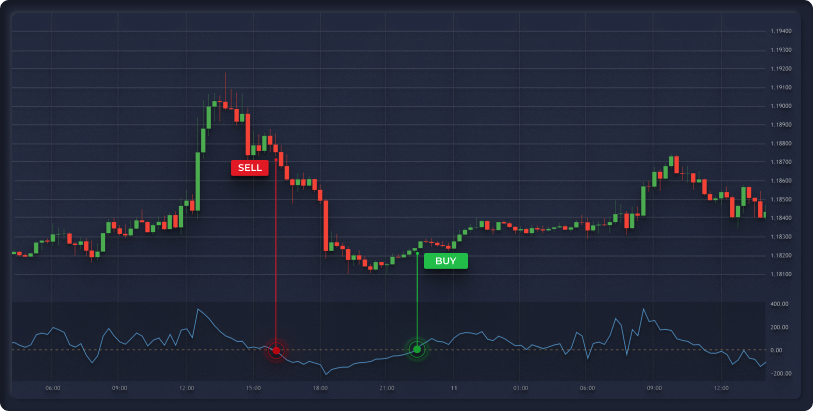
Signals are generated when level 50 is crossed. When crossing from top to bottom, a SELL signal is generated. When crossing from bottom to top, a BUY signal is generated. It must be above or below the level of the previous 6 candles to prevent false positives.


श्रेणी - रुझान।

In this case, the CCI indicator shows that the trend has already begun. If the market conditions are favorable, the trend will continue.

Signals to this algorithm are generated in the overbought and oversold zones. A BUY signal is generated when level 30 is crossed, and a SELL signal is generated when level 70 is crossed.


श्रेणी - परिवर्तन।

Classical technical analysis tells us that if the price is in the overbought zone, a reversal will likely occur and the price will go down and vice versa.

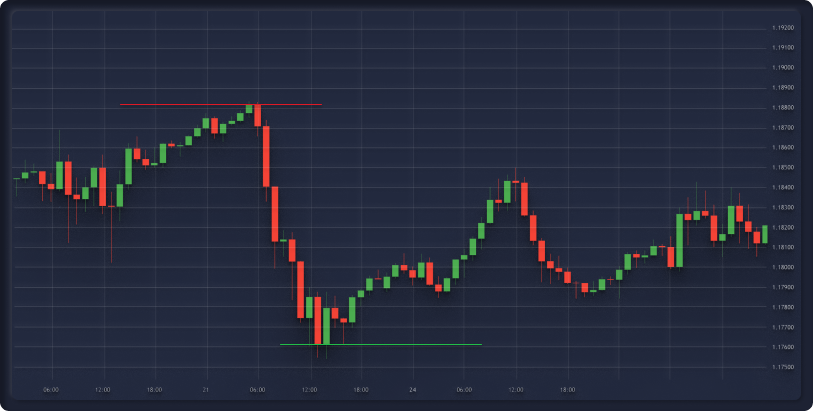
यह एल्गोरिदम समर्थन और प्रतिरोध स्तर बनाने के लिए स्थानीय निम्न और उच्च का उपयोग करता है। सिगनल तब उत्पन्न होता है जब कीमत एटीआर (14) के बराबर मध्य कैंडलस्टिक की दूरी पर किसी भी तरफ से किसी भी स्तर पर पहुंचती है।


इस सिगनल की एक विशिष्ट विशेषता यह है कि दो क्रय और विक्रय सिगनल एक साथ बनते हैं - एक सिगनल रिबाउंड के लिए, दूसरा सिगनल ब्रेकडाउन के लिए। हम अपने सांख्यिकीय एल्गोरिदम का उपयोग करके, वर्तमान बाजार के रुझान को देखते हुए सबसे संभावित परिणाम की गणना कर सकते हैं।

सिगनल्स की श्रेणी रुझान संकेतक पर निर्भर करती है।

यदि रुझान ऊपर की ओर है:

क्रय सिगनल - रुझान

विक्रय सिगनल - परिवर्तन

यदि रूझान नीचे की ओर है:

क्रय सिगनल - परिवर्तन

विक्रय सिगनल - रुझान
algorithms_pic algorithms_pic algorithms_pic