User menu

Sign up Login

How does it work?

signal

xSignals adalah seperangkat alat analitik lengkap untuk perdagangan di broker valas dan pertukaran mata uang kripto

More than 10 tools for detailed market analysis are available in the xSignals app: forex and crypto signals, online charts, trend indicator, and popular technical indicators.

Gunakan sinyal dan indikator tambahan untuk mengonfirmasi strategi perdagangan Anda.

signal
arrow_down

how to use?

Struktur sinyal

Study the structure of the signal and the meaning of each element of the signal in order to read the data for market analysis correctly. Signals are generated automatically based on technical analysis. The signal contains the supposed direction of the price and statistical data calculated on the history of signals and quotes history. In addition, statistical data showing the profitability of signals depending on various technical indicators are provided in the form of signal power and heatmaps.

Sinyal harus dianggap sebagai pemberitahuan kepada pedagang bahwa beberapa peristiwa penting telah terjadi di dalam pasar. Misalnya indikator RSI akan memberikan sinyal bahwa harga sudah overbought atau oversold, meskipun sinyal tersebut mengandung arah reversal, bukan berarti harga pasti akan berbalik arah. Pedagang harus memanfaatkan pengetahuan tambahan tentang pasar untuk membuka posisi berdasarkan sinyal.

?

Panel sinyal

Tombol cepat

Panel sinyal perdagangan

AUDUSD

SELL

0.71716

08:00

5 min

SRt

0.01

0.02

0.03

4/2

6/2

6/3

9/3

8/4

12/4

0.9

1.1

1.1

1.1

1.1

1.1

Aset Keuangan

Kekuatan & Peta panas

signal-power signal-power signal-power signal-power signal-power signal-power

iPP

0.5

iSummary

0.8

iWPR

1

iMomentum

1.2

iBulls

1.5

iBears

>2

Kekuatan sinyal dihitung berdasarkan data dari banyak sinyal lengkap serupa dan nilai tren. Menampilkan hasil untuk nilai indikator saat ini untuk satu kerangka waktu.

Peta panas adalah representasi grafis dari profitabilitas sinyal yang bergantung pada sinyal saat ini. Peta panas menunjukkan profitabilitas (faktor keuntungan) sinyal dengan menggunakan berbagai indikator penyaringan.


Indikator penyaringan Tren, Titik Pivot, Ringkasan, Rentang Persentase Williams, Momentum, Bulls, Bears digunakan untuk membangun pilihan sinyal, untuk perhitungan faktor keuntungan yang lebih lanjut.

Profit Factor

The profit factor is a performance indicator of a trading strategy, defined as the ratio of gross profit to gross losses. The sum of all profitable deals is divided by the sum of all losing deals. The trading system is profitable if the profit ratio is above 1.0.

Each signal algorithm is used as a trading strategy to calculate the profit factor. The trading strategy should contain:

  1. 1. Rules for opening positions at the moment of appearance of signals.
  2. 2. Aturan untuk menetapkan perintah stop: Stop Kerugian dan Ambil Untung.

Tentang kekuatan, peta panas, faktor keuntungan

Algoritma sinyal

COMMODITY CHANNEL INDEX (CCI)

RELATIVE STRENGTH INDEX (RSI)

SUPPORT & RESISTANCE

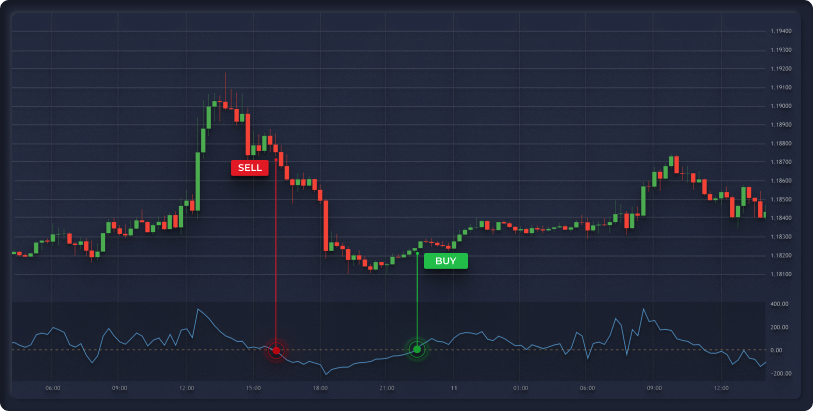
Signals are generated when level 50 is crossed. When crossing from top to bottom, a SELL signal is generated. When crossing from bottom to top, a BUY signal is generated. It must be above or below the level of the previous 6 candles to prevent false positives.


Kategori - Trending.

In this case, the CCI indicator shows that the trend has already begun. If the market conditions are favorable, the trend will continue.

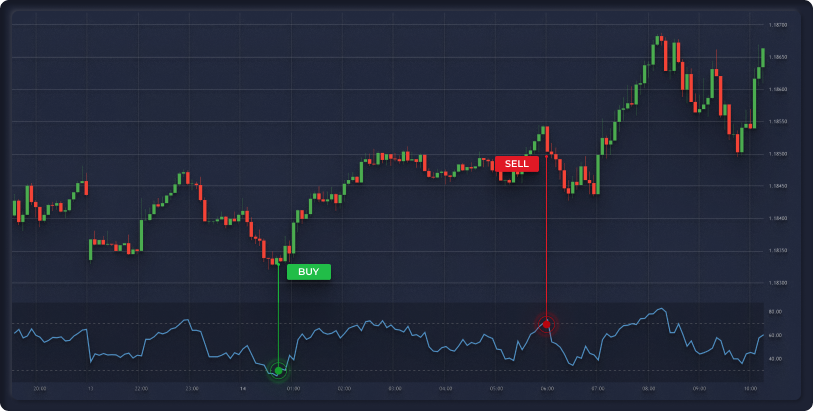
Signals to this algorithm are generated in the overbought and oversold zones. A BUY signal is generated when level 30 is crossed, and a SELL signal is generated when level 70 is crossed.


Kategori - Reversal.

Classical technical analysis tells us that if the price is in the overbought zone, a reversal will likely occur and the price will go down and vice versa.

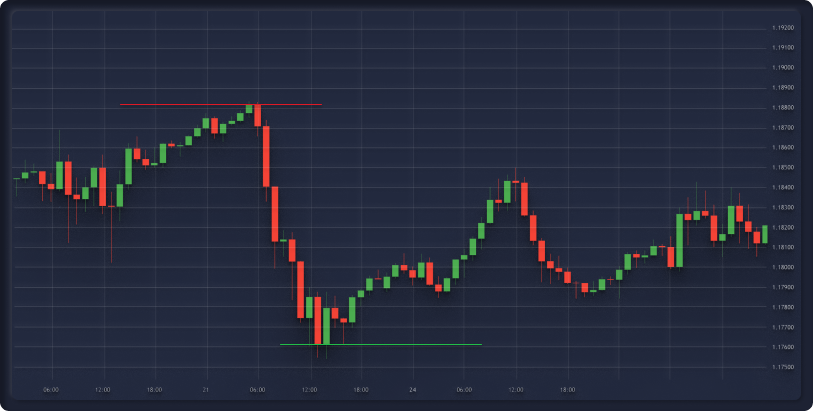
Algoritma ini menggunakan posisi terendah dan tertinggi lokal untuk membangun tingkat support dan resistance. Sinyal dihasilkan ketika harga mendekati tingkat mana pun dan dari sisi mana pun pada jarak lilin tengah yang sama dengan ATR (14).


Satu ciri khas dari sinyal ini adalah bahwa dua sinyal BUY dan JUAL terbentuk sekaligus - satu sinyal untuk memantul, sinyal lainnya untuk breakdown. Dengan menggunakan algoritme statistik kami, kami dapat menghitung hasil yang paling mungkin berdasarkan tren pasar saat ini.

Kategori sinyal bergantung pada indikator tren.

Jika tren naik:

Sinyal BELI - Trending

Sinyal JUAL - Reversal

Jika tren turun:

Sinyal BELI - Reversal

Sinyal JUAL - Trending

algorithms_pic algorithms_pic algorithms_pic