Visit JT Lab

User menu

Sign up Login

How does it work?

signal

xSignals is a complete set of analytical tools for trading on forex brokers and cryptocurrency exchanges

More than 10 tools for detailed market analysis are available in the xSignals app: forex and crypto signals, online charts, trend indicator, and popular technical indicators.

Use signals and additional indicators to confirm your trading strategy.

signal
arrow_down

how to use?

Struktur isyarat

Study the structure of the signal and the meaning of each element of the signal in order to read the data for market analysis correctly. Signals are generated automatically based on technical analysis. The signal contains the supposed direction of the price and statistical data calculated on the history of signals and quotes history. In addition, statistical data showing the profitability of signals depending on various technical indicators are provided in the form of signal power and heatmaps.

Signals should be considered as a notification to the trader that some significant event has occurred in the market. For example, the RSI indicator gives a signal that the price is overbought or oversold, although the signal contains a reversal direction, this does not mean that the price will definitely reverse. The trader must use additional knowledge of the market to open a position on a signal.

?

Signal panel

Fast buttons

Trading signal panel

AUDUSD

SELL

0.71716

08:00

5 min

SRt

0.01

0.02

0.03

4/2

6/2

6/3

9/3

8/4

12/4

0.9

1.1

1.1

1.1

1.1

1.1

Financial asset

Power & Heatmaps

signal-power signal-power signal-power signal-power signal-power signal-power

iPP

0.5

iSummary

0.8

iWPR

1

iMomentum

1.2

iBulls

1.5

iBears

>2

The signal power is calculated based on the data of many similar completed signals and the trend value. Shows the result for the current indicator value for one timeframe.

Heatmaps are a graphical representation of the profitability of signals depending on the current ones. Heatmaps show the profitability (profit factor) of signals using various filtering indicators.


Filtering indicators Trends, Pivot Points, Summary, Williams' Percent Range, Momentum, Bulls, Bears are used to build a selection of signals for further profit factor calculations.

Profit Factor

The profit factor is a performance indicator of a trading strategy, defined as the ratio of gross profit to gross losses. The sum of all profitable deals is divided by the sum of all losing deals. The trading system is profitable if the profit ratio is above 1.0.

Each signal algorithm is used as a trading strategy to calculate the profit factor. The trading strategy should contain:

  1. 1. Rules for opening positions at the moment of appearance of signals.
  2. 2. Rules for assigning stop orders: Stop Loss and Take Profit.

About power, heatmap, profit factor

Signal algorithms

COMMODITY CHANNEL INDEX (CCI)

RELATIVE STRENGTH INDEX (RSI)

SUPPORT & RESISTANCE

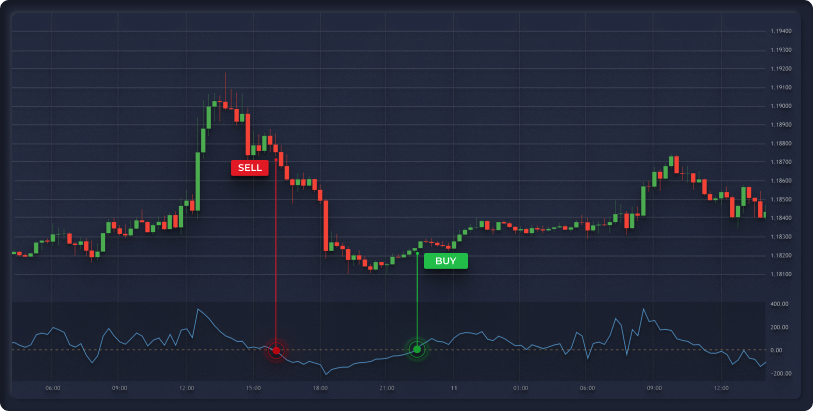
Signals are generated when level 50 is crossed. When crossing from top to bottom, a SELL signal is generated. When crossing from bottom to top, a BUY signal is generated. It must be above or below the level of the previous 6 candles to prevent false positives.


Category - Trending.

In this case, the CCI indicator shows that the trend has already begun. If the market conditions are favorable, the trend will continue.

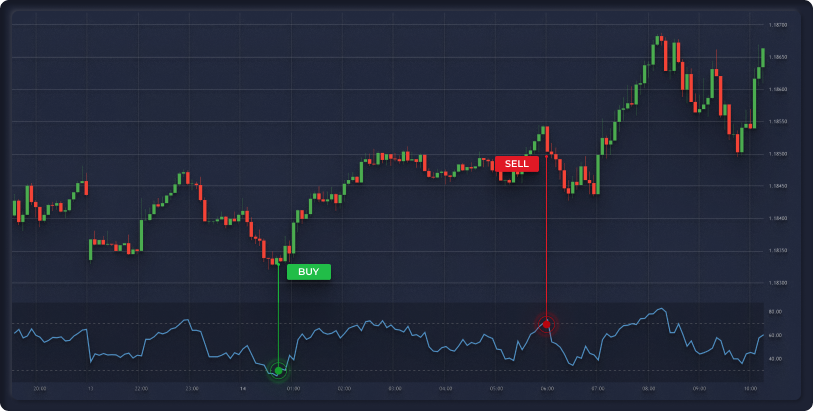
Signals to this algorithm are generated in the overbought and oversold zones. A BUY signal is generated when level 30 is crossed, and a SELL signal is generated when level 70 is crossed.


Category - Reversal.

Classical technical analysis tells us that if the price is in the overbought zone, a reversal will likely occur and the price will go down and vice versa.

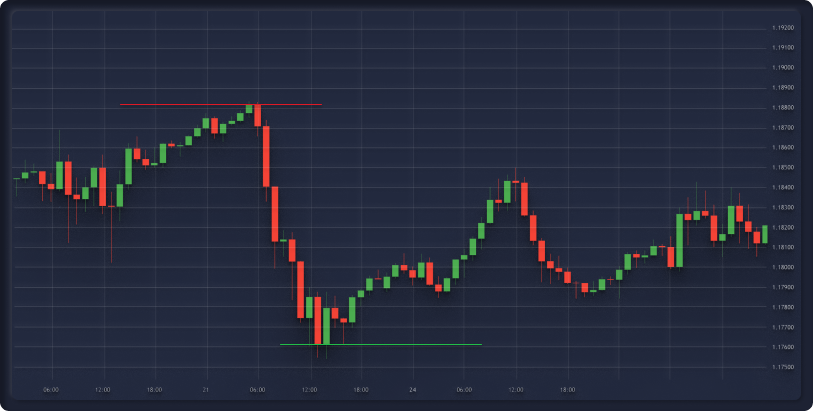
This algorithm uses local lows and highs to build support and resistance levels. The signal is generated when the price approaches any of the levels from any side at a distance of the middle candlestick equal to ATR (14).


A distinctive feature of this signal is that two BUY and SELL signals are formed at once - one signal for a rebound, the other signal for a breakdown. Using our statistical algorithms, we can calculate the most probable result given current market trends.

The category of signals depends on the trend indicator.

If the trend is up:

BUY Signal - Trending

SELL signal - Reversal

If the trend is down:

BUY Signal - Reversal

SELL signal - Trending
algorithms_pic algorithms_pic algorithms_pic